| Exercise 3 | The FME Data Inspector |
| Data | Parks (MapInfo TAB) Fire Halls (GML - Geographic Markup Language) Neighborhoods (Google KML) |
| Overall Goal | Examine city data to select a suitable neighborhood to live in |
| Demonstrates | Viewing, symbolizing, and querying data with the FME Data Inspector |
| Start Workspace | None |
| End Workspace | None |
The mayor of the city drops in to welcome you in your new job as technical analyst. He is fascinated by what FME can do and asks you to to inspect some data, to help pick a neighborhood for him to buy a new house in! As a GIS professional we wouldn't normally do spatial analysis in this way, but the mayor is unlikely to know that and anyway it's good practice with the FME Data Inspector.
1) Start FME Data Inspector
Start the FME Data Inspector
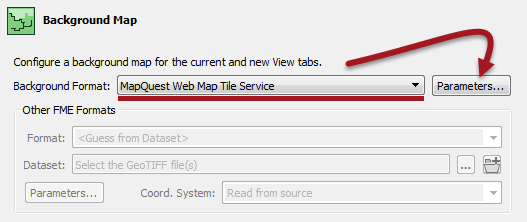
2) Set Background
When inspecting data it will help to have a background map to provide a sense of location. The FME Data Inspector is capable of displaying a backdrop from several different mapping services.
Select Tools > FME Options from the menubar. In the Background Map section, select a background map format of MapQuest Web Map Tile Service:
Click the Parameters button. A map constraint (type) dialog will open. Select OpenStreetMap.
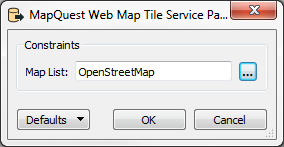
Click OK and OK again to close these dialogs.
3) Add Data
Now let's add some data. Select File > Open Dataset from the menubar. Set the reader parameters as follows:
| Reader Format | Google KML |
| Reader Dataset | C:\FMEData2016\Data\Boundaries\VancouverNeighborhoods.kml |
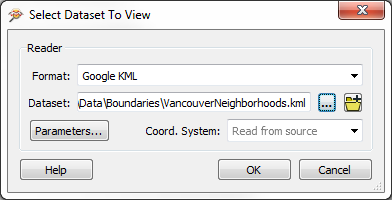
Click OK to close the dialog and add the data.
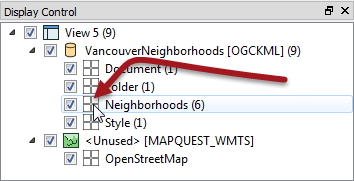
4) Set Data Symbology
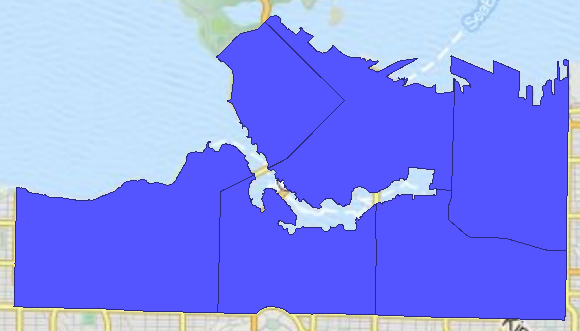
The data is added to the Data Inspector, but it is a solid-filled color and therefore obscures the background data.
Tiles Courtesy of MapQuest
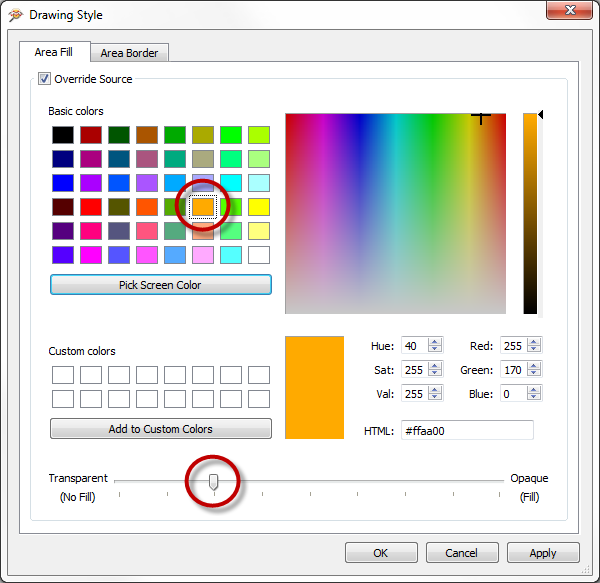
We can fix this by setting the symbology. Click the symbology icon for the Neighborhoods data in the Display Control window:
In the style dialog that opens, select a suitable color for the neighborhoods (say, orange). Then set the Transparency/Opacity scale to be somewhat less than half (i.e. more transparent than opaque).
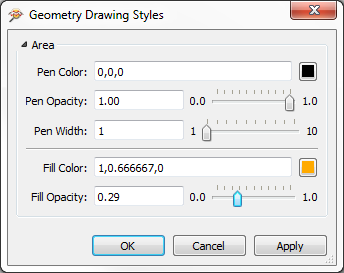
| .1 UPDATE |
The above dialog will look like this in FME2016.1:
|
Click OK to accept the parameters and close the dialog. The background map will now be visible through the neighborhood data.
5) Add More Data
The mayor has a pet dog and therefore wishes to live in an area that has a dog park. We must therefore add some parks data to the view.
Select File > Add Dataset from the menubar. Set the reader parameters as follows:
| Reader Format | MapInfo TAB (MITAB) |
| Reader Dataset | C:\FMEData2016\Data\Parks\Parks.tab |
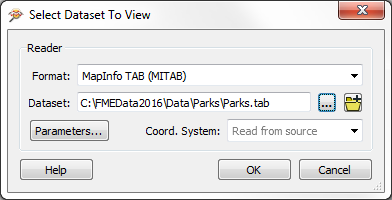
Click OK to close the dialog and add the data.
6) Filter Data
The parks data is opaque too (you may optionally change this to be more transparent) but more importantly we cannot tell which parks are dog parks.
Click on the tab marked Parks in the Table View window.
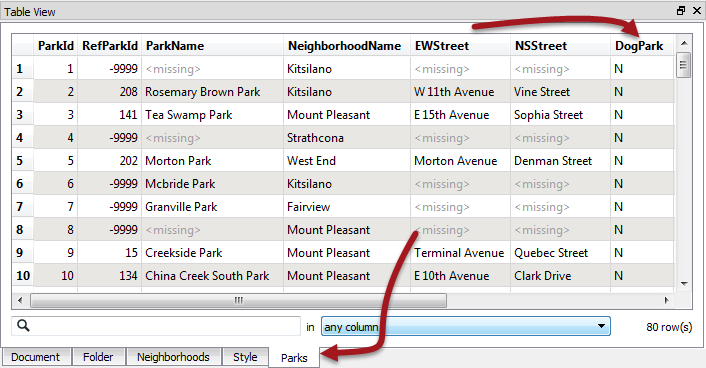
Notice that there are many parks in the city, but that there is also a DogPark attribute to tell us which parks have a dog run area. Click on the DogPark name to sort the table data by that attribute.
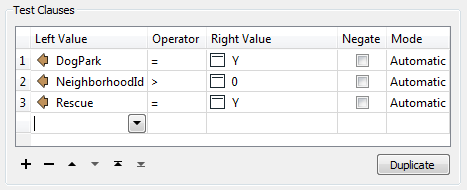
Now we know which are dog parks, clicking on a feature will highlight it on the display window. However, it would be easier to find dog parks if we could filter the data. Therefore choose Tools > Filter Features from the menubar.
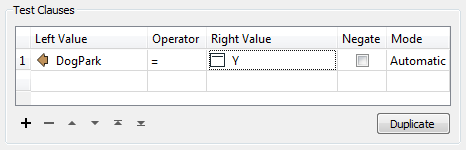
In the Filter Features dialog, double click in the Left Value field, click the drop down arrow, and select Attribute Value. Choose DogPark as the attribute to filter by and click OK.
For the Operator field select the = (equals) symbol, if it is not already selected.
For the Right Value field, click in the field and type the character Y (it should be upper case, not lower).
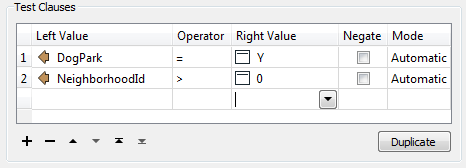
Filtering in the Data Inspector is applied to all visible data, therefore we must also add a clause to enable the neighborhood data to remain on screen.
Create a second test clause using the same techniques as before. This time test for where NeighborhoodID > (is greater than) 0 (zero)
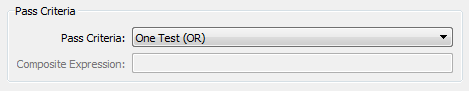
The Pass Criteria parameter should be set (or left as) "One Test (OR)."
Now click OK to close the dialog. The display will be filtered to show only the neighborhood features plus parks with a dog run facility.
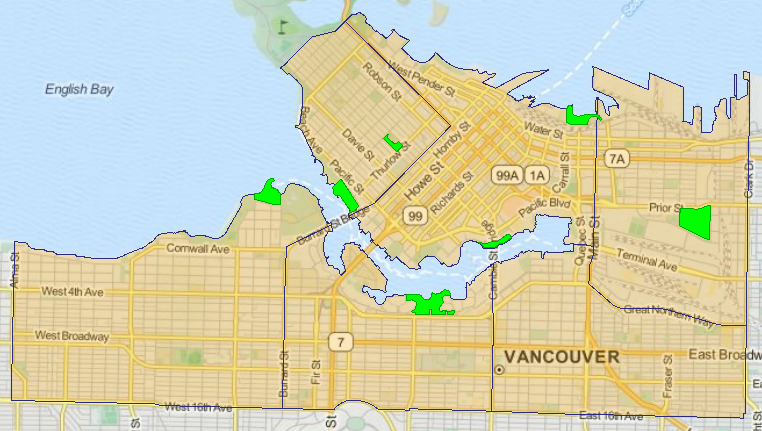
Tiles Courtesy of MapQuest
7) Add Data
The mayor's dog really is his best friend, and the mayor refuses to live in an area where there are no rescue services, just in case he gets lost chasing a cat! So let's add some emergency facilities data.
Select File > Add Dataset from the menubar. Set the reader parameters as follows:
| Reader Format | GML (Geography Markup Language) |
| Reader Dataset | C:\FMEData2016\Data\Emergency\FireHalls.gml |
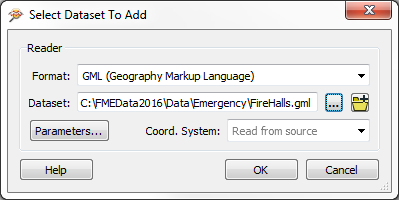
Click OK to close the dialog and add the data.
8) Filter Data
Initially no data will appear on screen because we already have a filter set that will exclude it.
So, again select Tools > Filter Features from the menubar. This time set up a test to filter where Rescue = Y (i.e. Fire Halls which are also a rescue facility).
At this point you should be able to suggest to the mayor a neighborhood that has both a dog park and an emergency rescue facility. Click on the neighborhood feature to find out which it is.
| CONGRATULATIONS |
By completing this exercise you have learned how to:
|